Basic 5 · Computing · Data, Sources and Usage
Making Tables and Diagrams from Data
In this topic you will organise collected data into tables and present it as pictograms and bar charts.
By the end of these notes you should be able to:
- Record data in a tally chart and frequency table
- Draw a pictogram and a bar chart
- Interpret tables and charts
What you already know
- Data types and collecting data
Copy everything that has a blue line on its left into your notebook. The other parts are for reading.
- Strand
- Introduction To Computing
- Sub-strand
- Data, Sources and Usage
- Indicator
- B5.1.3.1.8-10 – Make simple tables and diagrams from the collected data
Introduction
After collecting data, we must organise it so that others can understand it quickly. Tables and diagrams turn a long list of answers into a clear picture.
1. Tally Charts and Frequency Tables
A tally chart records data as you collect it. Each item is a stroke (I), and every fifth stroke crosses the other four, making groups of five that are easy to count. A frequency table shows the total (frequency) for each item.
| Fruit | Tally | Frequency |
|---|---|---|
| mango | IIII III | 8 |
| orange | IIII I | 6 |
| banana | IIII | 4 |
| pineapple | IIII II | 7 |
| pawpaw | III | 3 |
| Total | 28 |
2. Pictograms
A pictogram uses pictures or symbols to represent data. A key tells you what each symbol stands for. For example, if one fruit symbol = 2 pupils, mango needs 4 symbols and pawpaw needs 1½ symbols.
3. Bar Charts
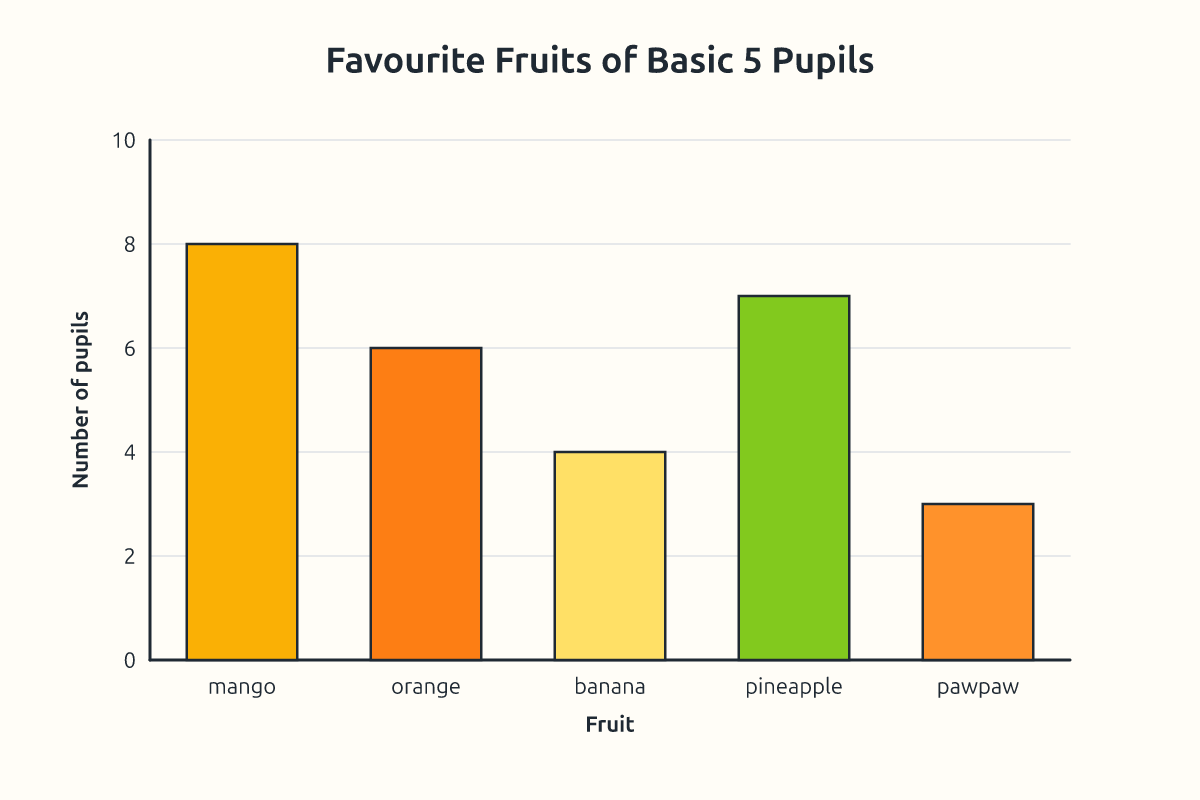
A bar chart uses bars of different heights. The horizontal axis shows the categories (fruits) and the vertical axis shows the frequency. All bars have the same width and equal gaps. Give the chart a title and label both axes.
4. Using a Computer
A spreadsheet program such as Microsoft Excel or Google Sheets can store data in a table and draw charts automatically. Type the categories in one column and the frequencies in the next. Select both columns and click Insert → Chart. The computer draws the chart in seconds.
5. Reading Charts
From the bar chart we can see that mango is the most popular fruit (the mode) and pawpaw the least popular. Mango was chosen by 5 more pupils than pawpaw (8 − 3 = 5).
New words
- tally
- A stroke used to count.
- frequency
- How many times something occurs.
- pictogram
- A chart using pictures.
- key
- Tells what each symbol stands for.
- bar chart
- A chart using bars.
- axis
- The line along the side or bottom of a chart.
Summary
- Tally charts record data; frequency tables show totals.
- Pictograms use symbols with a key.
- Bar charts use bars with labelled axes and a title.
- Spreadsheets can draw charts automatically.
Class activity: Class Data Chart
- Collect data on pupils' favourite sports.
- Make a tally chart and frequency table.
- Draw a bar chart on manila paper and present it.
You need: Bottle tops in two colours, Locally made tally cards, Manila paper
Exercises
Answer in your exercise book first, then check your answers.
1. What does a tally group of IIII with a line through it represent?
- A. 5
- B. 4
- C. 6
- D. 10
Show answer
Answer: 5Every fifth stroke crosses four.2. What tells you the value of each symbol in a pictogram?
- A. Key
- B. Title
- C. Axis
- D. Bar
Show answer
Answer: KeyIt explains the symbol.3. In the fruit table, how many more pupils chose pineapple than banana?
- A. 3
- B. 2
- C. 4
- D. 1
Show answer
Answer: 37 − 4 = 3.4. A bar chart should have a title.
- A. True
- B. False
Show answer
Answer: TrueIt tells what the chart shows.5. Bars in a bar chart can have different widths.
- A. True
- B. False
Show answer
Answer: FalseAll bars have the same width.6. The number of times something occurs is its ______.
Show answer
Answer: frequencyShown in the table.7. Which fruit was least popular and how many chose it?
Show answer
Answer: Pawpaw, 3 pupils.Shortest bar.8. If one symbol = 2 pupils, how many symbols show orange (6) and banana (4)?
Show answer
Answer: Orange 3 symbols, banana 2 symbols.Divide by 2.
Homework
- Count the colours of 20 cars passing your house. Make a tally chart and bar chart.